In 2018, 109 million Americans were age 50 or older; 48 million, 65 and older. Growth in the largest global supplement/functional food markets will be driven by older adults.1 (See Figure 1.)
For the first time last year, older adults were the least likely to take a multivitamin; 70% age 55 and older vs. 75% age 35-54, and 83% ages 18-34.2
Despite a clear split of the sports nutrition category into mainstream “fit” consumers vs. competitive/serious exercisers and bodybuilders, marketers continue to push similar products, (e.g., protein), to both groups.
DNA-based personalized nutrition kits are on the front burner, despite an accuracy of only 40%, according to the American College of Medical Genetics and Genomics.3 Sales of DNA-based kits are prohibited in New York, New Jersey, and Rhode Island, according to the CDC.4 GNC’s personalized “Solution Center” stops differentiating by age at 50 years old.
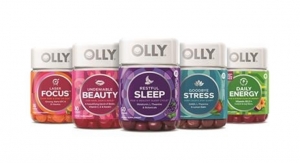
In fact, it’s been 10 years since a dietary supplement ranked among the non-food best-selling new CPG products. Olly supplements, posting year-one sales of $90.3 million, ranked #3 in 2018.5
Functional foods/beverages are facing similar challenges. “Other” has been the best-selling nutrition bar category for the past three years, posting high double-digit growth.6
Despite nearly half (47%) of consumers still seeking out foods/drinks with added vitamins/minerals in 2019—and 12 nutrient deficiencies of public health significance—marketers continue to cut back on food fortification in the name of a cleaner label.7,8
Heart health and weight management remain among the top benefits consumers most want to get from foods/drinks, yet except for low-participation trendy eating plans, they’ve been all but abandoned in marketing.9
This article is intended to help identify ongoing opportunities and emerging new directions for supplements, foods, beverages, and nutraceutical products/programs.
FIGURE 1: Current and Future Growth of Population Over 50 Years

Redefining Healthy Priorities
Over the last three years, consumers have redefined a healthy lifestyle to include regular exercise and attention to mental/emotional health.10 Seven in 10 millennials take a holistic approach to their health/nutrition issues; 64% of boomers, and 60% of gen X.11
Three-quarters believe “mind” is now as important as body.11 Sixty percent believe that feeling emotionally stable, and 51% having time to relax, are critical for healthy living.10
Those dubbed “fit” consumers, who live a healthy active lifestyle differentiated by integrating frequent physical exercise (three to five days per week) and a focus on enhancing their everyday mental/physical performance, are an untapped opportunity and may well represent as much as 40% of the U.S. adult population.12
In 2017, 60% of adults exercised three or more days/week for at least 30 minutes, up from 43% 10 years ago; 15% exercised six to seven days.13 Seven in 10 supplement users exercise regularly.2
Exercise is now more frequently used to treat/prevent many conditions (e.g., weight loss, anxiety, body aches/pains, cardiovascular concerns, insomnia, depression, lack of energy, memory/cognition decline, and arthritis/joint pain) than either foods, beverages, or supplements.14
Being “fit” has gone glam. Eight in 10 millennials/gen Zers believe “fit” is “the new pretty.” Nine in 10 said it’s “cool” to work out; 77% work out more often; and 78% said they don’t want to be skinny, but athletic.15
At the same time, the top U.S. health concerns have refocused to everyday performance issues.16 The ability to continue normal activities with age tops the list, memory ranks third overall; vision fourth; tiredness/lack of energy is fifth; dental health is sixth; and stress is eighth. Depending on age—sleep, mental sharpness, muscle health/tone, and back/neck pain are also listed in the top 10.
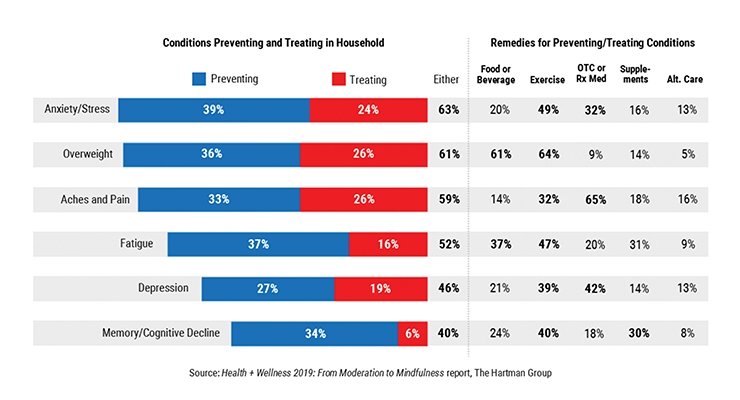
Stress/anxiety has replaced being overweight as the top health condition American households are trying to treat or prevent (see Figure 2). The trend is driven primarily by millennials and gen Z.17
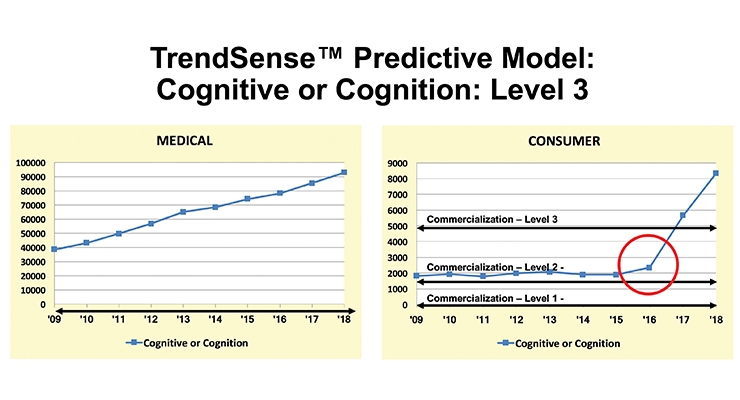
According to Sloan Trends’ TrendSense predictive model, the marketability of nearly all popular major mental health linkages showed explosive acceleration starting around 2016; including cognition, mental acuity, anxiety, and mood. New medical research studies/findings have followed suit at a torrid pace: mental acuity/sharpness and stress are both “Mega Level” market opportunities.18 (See Figure 3.)
FIGURE 2: Conditions Americans are Trying to Prevent/Treat by Household
Source: The Hartman Group, Health + Wellness 2019: From Moderation to Mindfulness report
FIGURE 3: TrendSense Predictive Model: Cognitive or Cognition: Level 3
Source: Sloan Trends, Inc.
Nutrition Business Journal (NBJ) estimated that brain cognitive supplements will reach $1.1 billion by 2022; mood, stress, and mental health supplements, $1.0 billion.19
Twenty-three percent of adults; 26% age 50 and older take a supplement for brain health; 10 million a proprietary brain supplement (e.g., Prevagen); 60 million a traditional supplement, (e.g., omega-3).20
Globally, “mental well-being” is the number one factor defining consumers’ perception of being healthy, followed by “feeling good.” Half of global consumers are looking for new solutions to prevent stress/anxiety issues, 48% sleeping problems, and 42% memory issues.21
Consumers look for products that provide long-lasting physical energy and energy they can draw on throughout the day at twice the rate of energy for exercise. “Mental” and “morning energy” to get the day started ranked third and fourth.16
After general health/nutrient deficiency, energy is the top reason consumers took a supplement in 2018, with 35% of users taking an energy supplement.22 NBJ projected sales of energy supplements will reach $2.5 billion by 2021, with a CAGR of 8% from 2019 to 2021.19
Sales of energy beverages in the U.S. jumped 8.4% in retail dollars last year and 8.6% in volume, making them the second-fastest-growing major beverage category after value-added water.23
Energy for adults 50 and older is a fast-emerging opportunity, as is energy for parents with kids at home. Parents with three or more kids at home are twice as likely to use energy beverages than others their age without children.24 Half (53%) of adults link high protein intake to energy.16
Although 32% of supplement users took a sports supplement last year (39% of millennials), growth in the sports nutrition/weight loss category has slowed to 7.7% in 2018, vs. 13.3% in 2013.2,19
Better targeting of sports nutrition products for the 60% of consumers who are regular exercisers (three to five days per week) vs. the 18% who participate in competitive sports, and the 14% of serious/strenuous exercisers (six to seven days per week) is a very big idea. Eighty-three percent of regular exercisers use sports nutrition bars and 86% beverages vs. 30% and 26%, respectively, of sports participants, and 26% and 28% of serious/strenuous athletes and bodybuilders.13
High-intensity interval, group, weight, and strength training top the list of 2019 global fitness trends; fitness programs for older adults rank eighth.25
Generational Reconsiderations
For the first time, there are five distinct generations of health/nutrition shoppers: matures, baby boomers, gen X, millennials, and gen Z.
In 2019, matures are aged 76 and older, baby boomers are 55-75, gen Xers are 40-54, and millennials are 25-39. Gen Z is defined by some demographers as everyone under age 24 and by others as those aged 11-24; either way, it makes them the largest and fastest-growing generation, depending on immigration.26
In 2015, the U.S. Census Bureau projected that millennials would number 73 million in 2020, boomers 69 million, gen Xers 61 million, and matures 21 million. Those aged 24 and younger were expected to top 81 million, again depending on immigration.26
In 2018, 78% of those aged 55 and older used supplements, 77% ages 34-54, and 69% ages 18-34. Those aged 55 and older are the most likely to take vitamin D, calcium, and magnesium. Those aged 35-54 are most likely to take B vitamins; and those aged 18-34 protein, vitamin C, fiber, green tea, a sport supplement, and amino acids.2
Millennials are parents to half of today’s children. More important, 80% of millennials are expected to be parents by 2026; 1 million millennials became new mothers in 2018.27 NBJ projected pre/post-natal vitamin supplements to reach $826 million by 2021.19
Despite one-third of children ages 2-19 being overweight or obese, parents are more concerned about physical development (i.e., height, bones, and muscle) than weight.16,28 Protein snacks/drinks and sports nutrition products aimed at the 72% of kids ages 6-12 who play team/individual sports are missed opportunities.
Gen Zers are emerging as full-fledged consumers. In 2017, over half of those aged 18-24 lived in their parents’ household29; nearly half of those aged 18-22 and one-quarter of those aged 23-24 were in college; one-quarter of those aged 18-24 worked full-time. The average annual income for young adults aged 18-24 in 2017 was $20,123.
Nearly half of gen Zers are regular exercisers.15 Stress, tiredness/lack of energy, muscle tone, mental sharpness, sleep, and skin are their main health concerns.16 One-quarter of gen Z teens take a supplement; 27% work out one or two times per week, and 23% do so three to four times weekly.30
Gen Zers are among the heaviest users of alternative snacks. Nine in 10 want to add more plant-based foods to their diet, and 50% experiment with specialized eating plans. Half of older gen Zers aged 18-24 describe themselves as a foodie, 42% aged 13-17. One-third have consumed non-dairy milks, quinoa, and/or cold brewed coffee; one-quarter superfoods, fusion cuisine, and/or spiralized/riced vegetables.30
Seniors (67%) are the most likely to report their financial situation as healthy, versus 53% of millennials.31 Perhaps more interesting is that as boomers age, they’re staying home more often. Although boomers have been the highest per capita restaurant spenders over the past 10 years, they are now the least likely generation to visit restaurants and are expected to drive an explosive new era of convenient and healthy home-based food/drink opportunities.32
With many Hispanics and Asians recording above-average use of supplements—and many ethnic groups suffering disproportionally higher rates of high blood pressure, cholesterol, stroke, arthritis/joint pain, and diabetes—better targeting for these segments is a very big idea. Hispanics already have above-average use of herbal supplements, single-letter vitamins, omega-3s, beauty supplements, and glucosamine/chondroitin.28, 33
Pet parents are another fast-growing demographic. In 2018, 26% of U.S. households had a cat and 39% had a dog. Sales for dog and cat foods are projected to reach $32 billion in 2019.34
Savvy marketers are targeting America’s 42 million affluent food consumers (household incomes over $150,000); their food spending is 74% higher than other shoppers. Affluent shoppers have a greater tendency to watch calories, buy healthy snacks, and purchase lower-calorie drinks.35
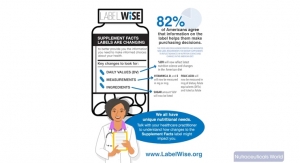
Sadly, the U.S. Department of Agriculture’s food stamp program, the Supplemental Nutrition Assistance Program (SNAP), which covered 40 million Americans in 2017, does not support the purchase of vitamins, medicines, or supplements; stating, “If an item has a Supplement Facts label, it is considered a supplement and is not eligible for SNAP purchase.”
Buying By Benefit
A dramatic shift in American’s food purchasing behaviors/decisions from one based primarily on brand and form, to one based on a product’s benefits (e.g., protein), will accelerate growth in the U.S. fortified/functional food market, projected by NBJ to approach $90 billion by 2022.35, 19
Four in 10 (38%) consumers are willing to pay a premium for products that deliver benefits “beyond basic nutrition,” vs. 30% for natural/organic.36 Just over half (54%) sought out functional foods/drinks in 2018, 52% all-natural, and 38% organic.37
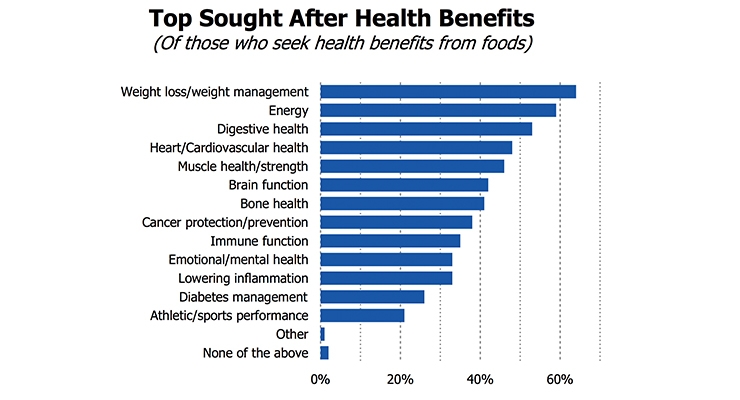
With 157 million (69%) U.S. adults overweight or obese, not surprisingly, weight control tops the 2019 list of health benefits consumers would most like to get from foods/beverages in 2019.9 NBJ projected sales of weight loss supplements, including meal replacements, will approach $7 billion by 2022.19
Despite 116 million consumers coping with high blood pressure, 93 million with cholesterol levels over 200 mg/dL, 71 million with high LDL cholesterol levels over 130 mg/dL, 46 million undesirably low HDLs (less than 40 mg/dL), and 29 million high triglyceride levels over 240 mg/dL,28 cardiovascular concerns dropped from first to fourth place vs. last year in the ranking of health benefits sought from food.9 (See Figure 4.)
FIGURE 4: Most Sought After Health Benefits from Food
Source: International Food Information Council, 2019
Among households that are trying to treat or prevent a specific condition, the percentage of those using diet, food, or beverages to do so is highest for weight control (61%), followed by diabetes (52%), food allergy/sensitivity (49%), high cholesterol (46%), irregularity (43%), fatigue (38%), acid reflux (30%), high blood pressure (29%), and osteoporosis (27%).14
The demand for diabetic-friendly fare and supplements continues to grow; 26 million U.S. adults have been diagnosed with diabetes, while 8 million are diabetic and remain undiagnosed. Ninety-two million have pre-diabetes; one-third of U.S. adults have metabolic syndrome.28
At the same time, consumers are increasingly buying supplements for a specific condition/benefit; younger consumers are the most likely to do so.16
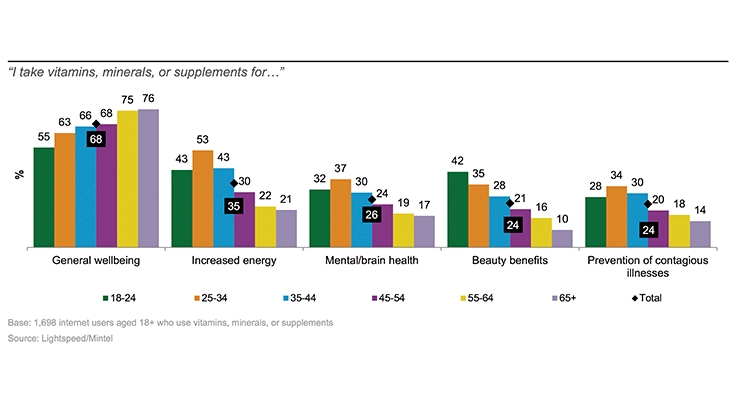
In 2018, after general health/specific nutrient deficiency, consumers were most likely to buy a supplement for energy, followed by mental/brain health, beauty, immunity, and inflammation.22 (See Figure 5.)
FIGURE 5: Reasons for Taking a Specific Type of Supplement by Age
Base: 1,698 internet users aged 18+ who use vitamins, minerals, or supplements
Source: Mintel. 2018
In 2018, 75% of supplement users took a multivitamin, 38% vitamin D, 30% vitamin C, 26% calcium/B complex, 22% protein, 20% magnesium or omega-3, 17% probiotics, 16% green tea, 15% vitamin E, and 14% fiber or turmeric.2
While one in five adults still think they don’t get enough of their basic vitamins/minerals, even more consumers—30% of gen Xers, 27% of millennials, and 24% of adults overall—worry they’re not getting enough specialty nutrients.37
After vitamins/minerals, specialty supplements were the most used dietary supplement, taken by 51%; herbals/botanicals by 41%; sports nutrition 32%; and weight management supplements 20% last year.2
In 2018, U.S. supplement sales reached $46 billion, up $6.1 billion vs. the previous year, according to NBJ. Vitamins/minerals accounted for 30% of sales, herbs/botanicals 19%, specialty and other 18%, sports nutrition supplements 14%, meal supplements 12%, and minerals 7%.19
Conditional Realignment
As aging boomers fight to maintain an active lifestyle, everyday issues that were once the purview of younger generations (e.g., energy, sports nutrition, weight, muscle/strength, and sleeplessness) are moving onto their front burner.38
Those aged 50 and over cited heart health, muscle health/mobility, energy, brain health, and weight as their most important health topics.39 Sarcopenia, diverticulitis, mobility issues, stroke, osteoporosis in men, weight maintenance, and improved balance will be among the new true conditions of aging.38
Conversely, millennials are now the most likely to complain about digestive issues, regularity, joint/back pain, skin issues, bone strength, and lack of mental sharpness.38 In descending order, fiber, omega-3s, probiotics, digestive enzymes, and collagen were the most-often taken specialty supplements by those 18-34.2 One-third are trying to manage digestive problems; one in five daily. In 2017, 83% experienced some type of digestive issue; 65% suffered indigestion, gas, bloating, or flatulence; 56% heartburn/reflux; 54% diarrhea; and 48% constipation.38
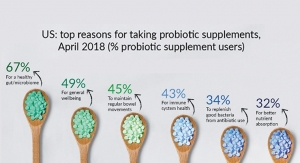
One-third (37%) of U.S. consumers are extremely/very interested in the gut microbiome, led by those ages 18-39 and households with kids. Six in 10 (58%) believe that digestive health/microbiome is extremely/very important for weight management, 57% daily energy levels and overall mental well-being, 55% immune function, 54% aging well, 51% mood, 51% stress levels, and 48% physical appearance.16
Prebiotics are fast moving into the spotlight with supplement sales projected to top $399 million by 2020; symbiotic supplements $881 million.19
After gut health and/or supporting probiotics, regularity, fiber, immunity, and brain health are the leading consumer associations with prebiotics.40 The global prebiotics market is projected to reach $7.7 billion by 2025.41
Probiotic supplement sales reached $2.4 billion in 2018, up 9%; NBJ projected sales will top $3 billion by 2022. Gut health supplement sales climbed 10.5% in 2018.19 Sales of pet foods touting probiotics/prebiotics jumped 24% in 2018.41
Bone health/strength is seventh on consumers’ list of health concerns.16 One-third of adults age 55 and over took a calcium supplement last year, 25% aged 18-34, and 22% aged 35-54. One-quarter of adults age 55 and over took a magnesium supplement.2
One-third of those aged 35-54 cited immune health as their top reason for using supplements; projected to reach $3.6 billion by 2021.19
Eye health and hair/skin/nail health are missed opportunities for food manufacturers. Supplement sales are projected to reach $749 million and $1.2 billion, respectively, by 2021.19
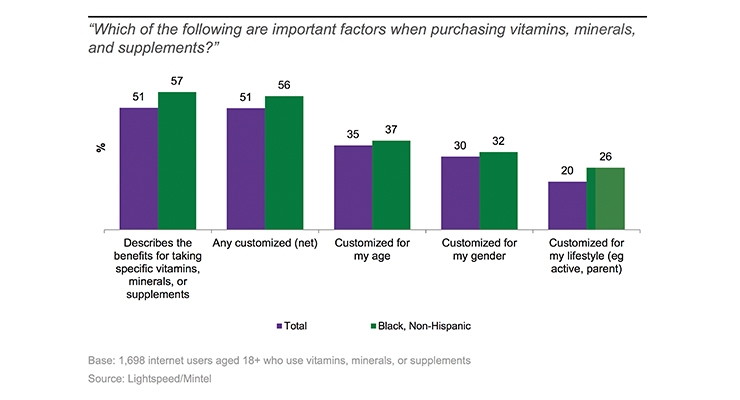
Customization is the most important reason for taking a specific supplement, after price. One-third said customized for their age is important, 30% their gender, and 20% their lifestyle.22 (See Figure 6.)
FIGURE 6: Product Factors when Buying a Supplement
Source: Mintel, 2018
At the same time, consumers are turning to do-it-yourself monitoring and researching other solutions before seeking professional help; 52% of millennials are interested in connecting with a virtual assistant to identify symptoms for health issues, 38% gen X, 20% of boomers, and 12% aged 65 and over.42
Muscle/strength is the number one reason that consumers buy personal exercise equipment, followed by weight loss 64%, cardiovascular health 57%, cognitive function 47%, and energy 41%.43
Ingredients
Herbs/botanicals are the fastest-growing supplement category, taken by 41% of supplement users last year, up 13% versus five years ago.2 Herbal supplement sales reached an all-time high of $8.8 billion in 2018, up 9.1%.19
Hemp/CBD supplement sales hit $238 million in 2018 and are projected to reach $520 million by 2021.19 Anxiety, pain, relaxation, sleeplessness, and depression are the top reasons for use.
Young adults were most likely to use green tea supplements at 24%, cranberry 13%, and ginseng 13%.2 Horehound, cranberry, echinacea, green tea, black cohost, garcinia, flax seed/oil, ginger, ivy leaf, and turmeric are the best-selling herbal supplements in mass channels; turmeric, wheatgrass/barley, flax seed/oil, aloe, elderberry, milk thistle, maca, ashwagandha, echinacea, and saw palmetto in the natural channel.44
Fermented foods, followed by avocado, seeds, ancient grains, exotic fruit (e.g., acai), blueberries, beets, nuts, coconut products, and non-dairy milks round out the top 10 list of hot superfoods for 2019.45
Turmeric, chia seeds, kale goji/lingon berries, moringa, matcha, maca, ginger, mushrooms, cumin seeds, yerba mate, acerola, and black garlic are among the growing global superfoods.46 Turmeric supplement sales are projected to reach $500 million in 2021.19
Awareness for many ingredients popular in the industry is still quite low. For example, 76% are unaware of natto, 68% maca, 55% manuka honey, 53% primrose oil, 36% wheatgrass, and 30% bee pollen.47
Beets, bone broth, soy, dates, activated charcoal, fermented vegetables, ginger, whole oats, cacao, apple cider vinegar, and avocado oil are among the trendy ingredients that have very low affinity with millennials and gen Z.47
Honey is perceived as the cleanest sweetener followed by brown sugar, beet sugar, agave, cane sugar, stevia, monk fruit, and brown rice syrup in descending order.46
Food for Thought
In 2019, fiber, whole grains, protein, omega-3s, and probiotics topped the list of food ingredients consumers are trying to consume.9
Sales of all edibles with a protein claim jumped 9% in 2018; those with a protein plus a “no preservative” or “no hormones” claim rose 15%, protein plus “GMO-free” 21%; plus “whole grains” 27%; plus “no antibiotics” 41%, and plus “probiotics” 59%.47
Muscle health/tone is now the top benefit consumers (56%) link to a high protein diet; 53% link physical energy; 47% weight management; 42% healthy hair, skin, and nails; 41% mental energy; 40% brain nourishment; 39% bone health, 35% sports recovery; and 33% athletic performance.16
Of the 27% of supplement users who took a protein supplement last year, 44% opted for plant protein.2 However, only 16% connect plant-based foods/protein to muscle growth, per Mintel.48
Seventeen percent of adults used protein beverages in 2018, 12% meal replacements/mixes, 11% nutritional drinks (e.g., Boost), and 6% weight loss drinks/mixes.48 NBJ projected sales of sports powder supplements will approach $7 billion by 2022, with a CAGR from 2020-22 of about 6%.19
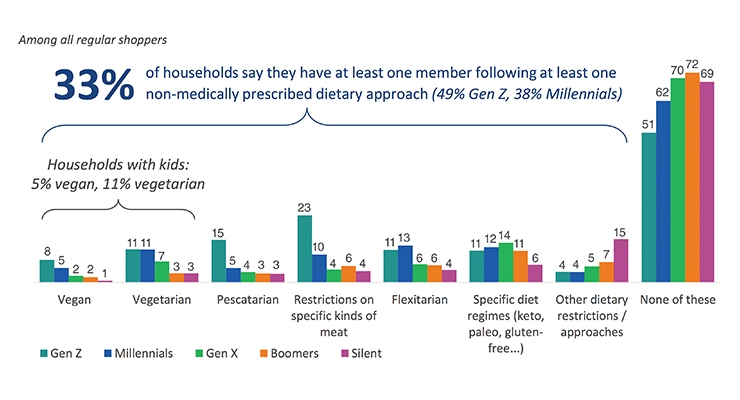
Experimentation with various eating regimens continues, with 38% of consumers following a specific regimen or diet in 2019. Clean eating and intermittent fasting are the most followed dietary plans in 2019, followed by gluten-free and low carb.9
The percentage of consumers following the Keto diet, although less than 10% of consumers, has doubled since 2018; while less than half remained on the Paleo and Whole 30 diet this year.9 Fewer than 5% of consumers are interested in recipes based on diet plans such as Paleo or Keto.37 Risky to marketers is that consumers don’t stay on these diets and often interchange their eating programs by day part (e.g., vegan for lunch and Paleo at dinner). Also, overall numbers of consumers following specific dietary regimens is low. Those aged 18-39 and those in households with children are most interested in eating clean; interest declines with age.49 (See Figure 7.)
FIGURE 7: Dietary Approaches by Age (Percent of Households Following Specific Diets)
Source: Food Marketing Institute, 2019
Look for vegan to be the new gluten-free; not in the absolute sense, but as an indicator of cleaner, less processed foods. Twenty-nine percent of gen Z said a vegan claim enhances a food product’s appeal.30
Seventeen percent of consumers reported having a food allergy in the household; peanut, milk and shellfish are the most cited.9
While personalized nutrition diet plans prescribed by various food apps represent another fast-moving nutrition trend, they may not be reliable. It is important to note that FDA has not reviewed the efficacy of the foundational algorithms for these apps, nor have other authoritative and independent bodies. No clinical studies have been conducted to verify results either.
Just about half (47%) of consumers snack three or more times per day. Over the last four years, those aged 25-34 who snack three or more times per day increased 13%; those 35-44, up 9%.6 In 2018, permissible indulgence remained the fastest-growing snack segment, up 3.9% vs. true indulgence up 2.9%, wellness up 1.6%, and treats up 1.2%.6
Seven in 10 adults under age 44 want snacks that provide an energy boost; 63% that contain vitamins and minerals. Fifty-eight percent of all adults are looking for snacks that offer benefits beyond basic nutrition, up 8% from 2015; 55% want snacks that provide a serving of fruit/vegetables, up 7%.6
Millennial organic snack purchases jumped 10% over the past two years; gen Xers’ up 6%, and boomers’ up 7%. Albeit from a very small base, dollar sales of vegan snacks jumped 16% in 2018. IRI projected that sales of high protein snacks made with chickpeas will grow 35% in the next few years; made with beans up 25%.6
Two-thirds of consumers often choose a beverage as a snack, up 8% over the past two years; 71% of those ages 18-24.6
Just over one-quarter of adults under age 55 buy shakes/beverage mixes, about 45% buy bars; for older adults, the figures are just over 10% and 30%, respectively.50 Of those who buy nutrition bars and shakes, 87% and 46%, respectively, eat them as a snack. Rx bar was the fifth best-selling new food/beverage product in 2018 with year-one sales of $73.9 million.5
Consumers are most interested in shakes that provide weight management; followed by vitamins/minerals, sustained energy, and a burst of energy.16
One-quarters of millennials often buy cold-pressed juices and produce-infused waters; more than double the rate of their older counterparts.51
One-quarter (24%) of consumers said they’re eating more plant-based protein now than in 2018; 12% are eating more animal protein. Integrating plant-based protein/ingredients into their diet is most common among gen Z and millennials, households with kids, and households with income of $75,000 or more.9
Of those who serve plant-based meals at least occasionally, 49% serve beans/chickpeas/lentils (legumes), 48% nuts/seeds, 30% veggie burgers, 29% quinoa or other grains, and 17% tofu/tempeh.52 Meat alternatives with pea, soy, or wheat proteins alone or in combination with other ingredients scored the highest for purchase intent; followed by brassica vegetables, chickpeas, pulses, rice, eggs, and quinoa.53
Sales of plant-based foods reached $4.5 billion, up 11% for the year ended Apr. 21, 2019. Sales of plant-based meats grew 10%, plant milks 6%, creamers 40%, and yogurt 39%.54
Naturally Speaking
Organic food sales reached $47.9 billion, up 5.9%.55 Millennials spent 14% more on organic products and made 9.8% more trips to buy organic products last year. Urban shoppers and Hispanics over-index for organic food use.49
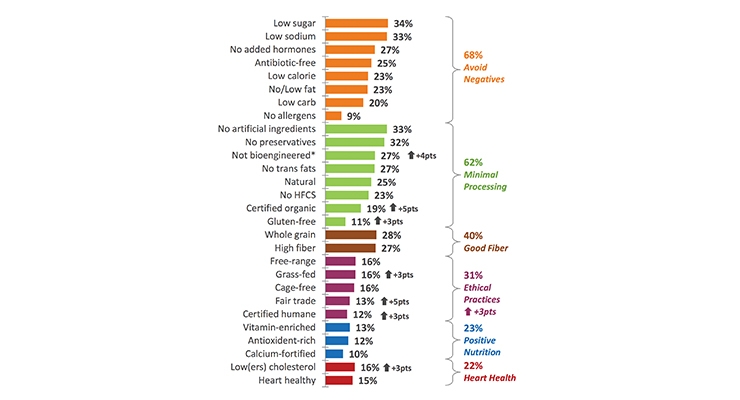
Avoidance claims are the most sought-after from purchasing foods/beverage, followed by those that reflect minimal processing.49 (See Figure 8.)
FIGURE 8: Product Claims Consumers Seek When Purchasing a Food or Beverage
Source: Food Marketing Institute, 2019
The importance of fair trade and certified organic claims have increased 5 percentage points vs. 2018, non-GMO/bioengineered down 4 points; and gluten-free, grass fed, certified humane, and lowers cholesterol up 3 points.49
In the food retail space, the highest growth related to sustainability is among products touting sustainable farming and social responsibility, with sales up 14% and 8%, respectively in 2018. For the year ended Jun. 5, 2018, products featuring sustainable resource management saw sales growth of 6%; the growth rate for sustainable seafood is 3%.56
Venues
Check-out counters and in-store clinics are among the fast-emerging channels for healthy snacks and supplements. Of the 37% who are seriously influenced at check-out, 48% want healthy snacks, 60% over age 55; 33% want ready-to-drink smoothies and juices.6 Households with chronic ailments are most likely to visit an in-store clinic.
Summary
There hasn’t been a more influential lifestyle shift in the past few decades than the desire of aging baby boomers to lead an active, healthy, and convenience-oriented life. New conditions of aging, an increase in the number of infants/young children, and pervasive concerns over a lack of energy (with greater stress and anxiety) will cause consumers—both young and old—to further embrace functional foods.
References
- Euromonitor. 2019. Top 10 Global Consumer Trends 2019. London, U.K. www.euromonitor.com
- CRN. 2018. Consumer Survey on Dietary Supplements. Council for Responsible Nutrition, Washington, D.C. www.crnusa.org
- ACMG Board of Directors. 2016. Direct-to-consumer genetic testing: a revised position statement of the American College of Medical Genetics and Genomics. Genet Med 18(2):207-8
- CDC. 2017. “Think Before You Spit.” Centers for Disease Control and Prevention, April 18. https://blogs.cdc.gov/genomics/2017/04/18/direct-to-consumer-2/
- IRI. 2019. New Product Pacesetters. Information Resources Inc., Chicago, IL. www.iriworldwide.com
- Lyons Wyatt, S. 2019. “How America Eats: The State of the Snack Food Industry.” IRI webinar, April 9. Information Resources Inc., Chicago, IL. www.iriworldwide.com
- Lyons Wyatt, S. 2019. How American Eats: Stirring the Melting Pot. June. Information Resources Inc., Chicago, IL. www.iriworldwide.com
- HHS. 2015. 2015-2020 U.S. Dietary Guidelines. Washington, DC. www.usda.gov
- International Food Information Council. 2019. Food & Health Survey. Washington, D.C. www.foodinsight.com
- Mintel. 2017. Healthy Lifestyles – US – Oct. Chicago, IL www.mintel.com
- Lyons Wyatt. S. 2018. “Holistic Health, Convenience. IRI’s Top Trends in Fresh Webinar Series, 1 of 5.” Information Resources Inc., Chicago, IL. www.iriworldwide.com
- Sloan, A.E. and Adams Hutt, C. March 2019. “Getting Ahead of the Curve: The Fit Consumer,” Nutraceuticals World, Montvale, NJ. www.nutraceuticalsworld.com
- MSI. 2017. The 2017 Target Market Report on Exercise and Fitness Lifestyles. Multi-sponsor Surveys, Princeton, NJ. www.multisponsor.com
- Hartman Group. 2017. Health & Wellness 2017. Bellevue, WA. www.hartman-group.com
- Ypulse. 2018. Health & Fitness Survey. June. New York, NY. www.ypulse.com
- Healthfocus Intl, 2019. U.S. Consumer Health Survey. St. Petersburg, FL. www.healthfocus.com
- Hartman Group. 2019. Health + Wellness 2019: From Moderation to Mindfulness. Bellevue, WA. www.hartman-group.com
- Sloan Trends Inc. 2019. TrendSense Predictive Model.
- NBJ. 2019. Nutrition Business Journal and Statistical Data Sheets. Boulder CO. www.newhope.com
- AARP, 2019. 2019 AARP Brain Health and Dietary Supplements Survey. June. Washington, D.C. www.aarp.org
- Euromonitor, 2019. Healthy Living Webinar, July. London, U.K. www.euromonitor.com
- Mintel. 2018. Vitamins, mineral & supplements U.S. Sept Chicago, IL. www.mintel.com
- Beverage Marketing. 2019. May 29, 2019 press release, “U.S. Liquid Refreshment Beverage Market.” www.beveragemarketing.com
- Packaged Facts. 2017. Energy and Sports Drinks: U.S. Retail Market Trends & Opportunities. May. Rockville, MD. www.packagedfacts.com
- Thompson, W. 2018. Worldwide Survey of Fitness Trends for 2019. ACSM’s Health & Fitness J. Nov/Dec 22(6):10-17
- U.S. Census. 2015. U.S. Dept of Commerce. Washington, D.C. www.census.gov
- Ypulse. 2019. New Parents on the Block. April. New York, NY. www.ypulse.com
- AHA. 2019. Heart Disease and Stroke Statistics—2019. American Heart Assoc., Dallas. www.heart.org
- Packaged Facts. 2018. Looking Ahead to Gen Z. July. Rockville, MD. www.packagedfacts.com
- Ypulse. 2018. Food & Cooking Survey. March. New York, NY. www.ypulse.com
- Driggs, J. 2019. “Consumer Confidence Reflected in E-Commerce Growth.” Information Resources Inc., Chicago, IL. Feb. Consumer Connect Q4
- Riehle, H. 2019. “Restaurant Industry 2019 and Beyond.” Presented at the Human Resources & Risk and Safety Executive Study Group Conference, Louisville, KY, Feb. 6
- Packaged Facts. 2019. Affluent Food Shoppers. May. Rockville, MD. www.packagedfacts.com
- American Pet Products Association. 2019. Pet Industry Market Size & Ownership Statistics. Stamford, CT. www.americanpetproducts.org
- IRI. 2017. “Realigning for Growth: Win by Innovating across CPG Market Segments.” Sep. Chicago, IL. www.iriworldwide.com
- IRI. 2018. “Early View 2018: Q1 Food & Beverage Trends.” May. Chicago, IL. www.iriworldwide.com
- Food Marketing Institute. 2018. U.S. Grocery Shopper Trends. Arlington, VA. www.fmi.org
- Sloan E and Adams Hutt C. 2018. Getting Ahead of the Curve: Conditional Redirections. May. Nutraceuticals World, Montvale, NJ. www.nutraceuticalsworld.com
- International Food Information Council. 2018. Nutrition Over 50., Washington, D.C. www.foodinsight.com
- Monheit, L. 2018. “Prebiotics: Past, Present, and Future.” Presented at Supply Side West, Las Vegas, NV. Nov. 9.
- Packaged Facts. 2019. Pet Market Outlook. Rockville, MD. www.packagedfacts.com
- Deloitte. 2018. U.S. Health care consumers. Boston Consulting Group, Profiting from Personalization. May. www.deloitte.com
- ECRM’s/Wella. 2016. Study: Efficacy, Info Drive Vitamin, Diet & Sports Nutrition Sales. Jan. www.ecrm.marketgate.com
- Smith, T. 2018. HerbalGram 119: 62-71.
- Pollock Communications. 2018. 7th Annual what’s trending in nutrition survey. New York, NY. www.pollackpr.com
- Nielsen. 2018. “Purposeful Ingredients Are Driving U.S. Retail Growth.” Press release, Sept. 27. New York, NY. www.nielsen.com
- Datassential. 2018. Functional Foods. Nov. Los Angeles, CA. www.datassential.com
- Mintel Intl. 2018. Nutrition and Performance Drinks—U.S. March. Chicago, IL. www.mintel.com
- Food Marketing Institute. 2019. U.S. Grocery Shopper Trends., Arlington, VA. www.fmi.org
- Packaged Facts. 2017. Nutritional Shakes and Bars. Nov. Rockville, MD. www.packagedfacts.com
- Food Marketing Institute. 2019. Power of Produce. Trends, Arlington, VA. www.fmi.org
- Food Marketing Institute 2019. Power of Meat. Arlington, VA. www.fmi.org
- Johnson, P. 2018. “What Consumers Really Think About Alternative Proteins.” Presented at Institute of Food Technologists Annual Meeting, Chicago, IL. July 16-18
- Plant-Based Foods Association, 2019. U.S. Plant-based Retail Market Worth $4.5 Billion, Growing at 5X Total Food Sales. Press release: July 12, 2019. PBFA, San Francisco, CA. www.plantbasedfoods.org
- Organic Trade Association. 2019. U.S. Organic Sales Break Through $50 Billion Market in 2018. Press release. May 19. Washington, D.C. www.ota.com
- Nielsen. 2019. Fresh Trends: “Tracking the Four Trends Driving Growth Across the Fresh Section.” Press release, Feb. 27. New York, NY. www.nielsen.com


